Using the antarctic_plots.regions module#
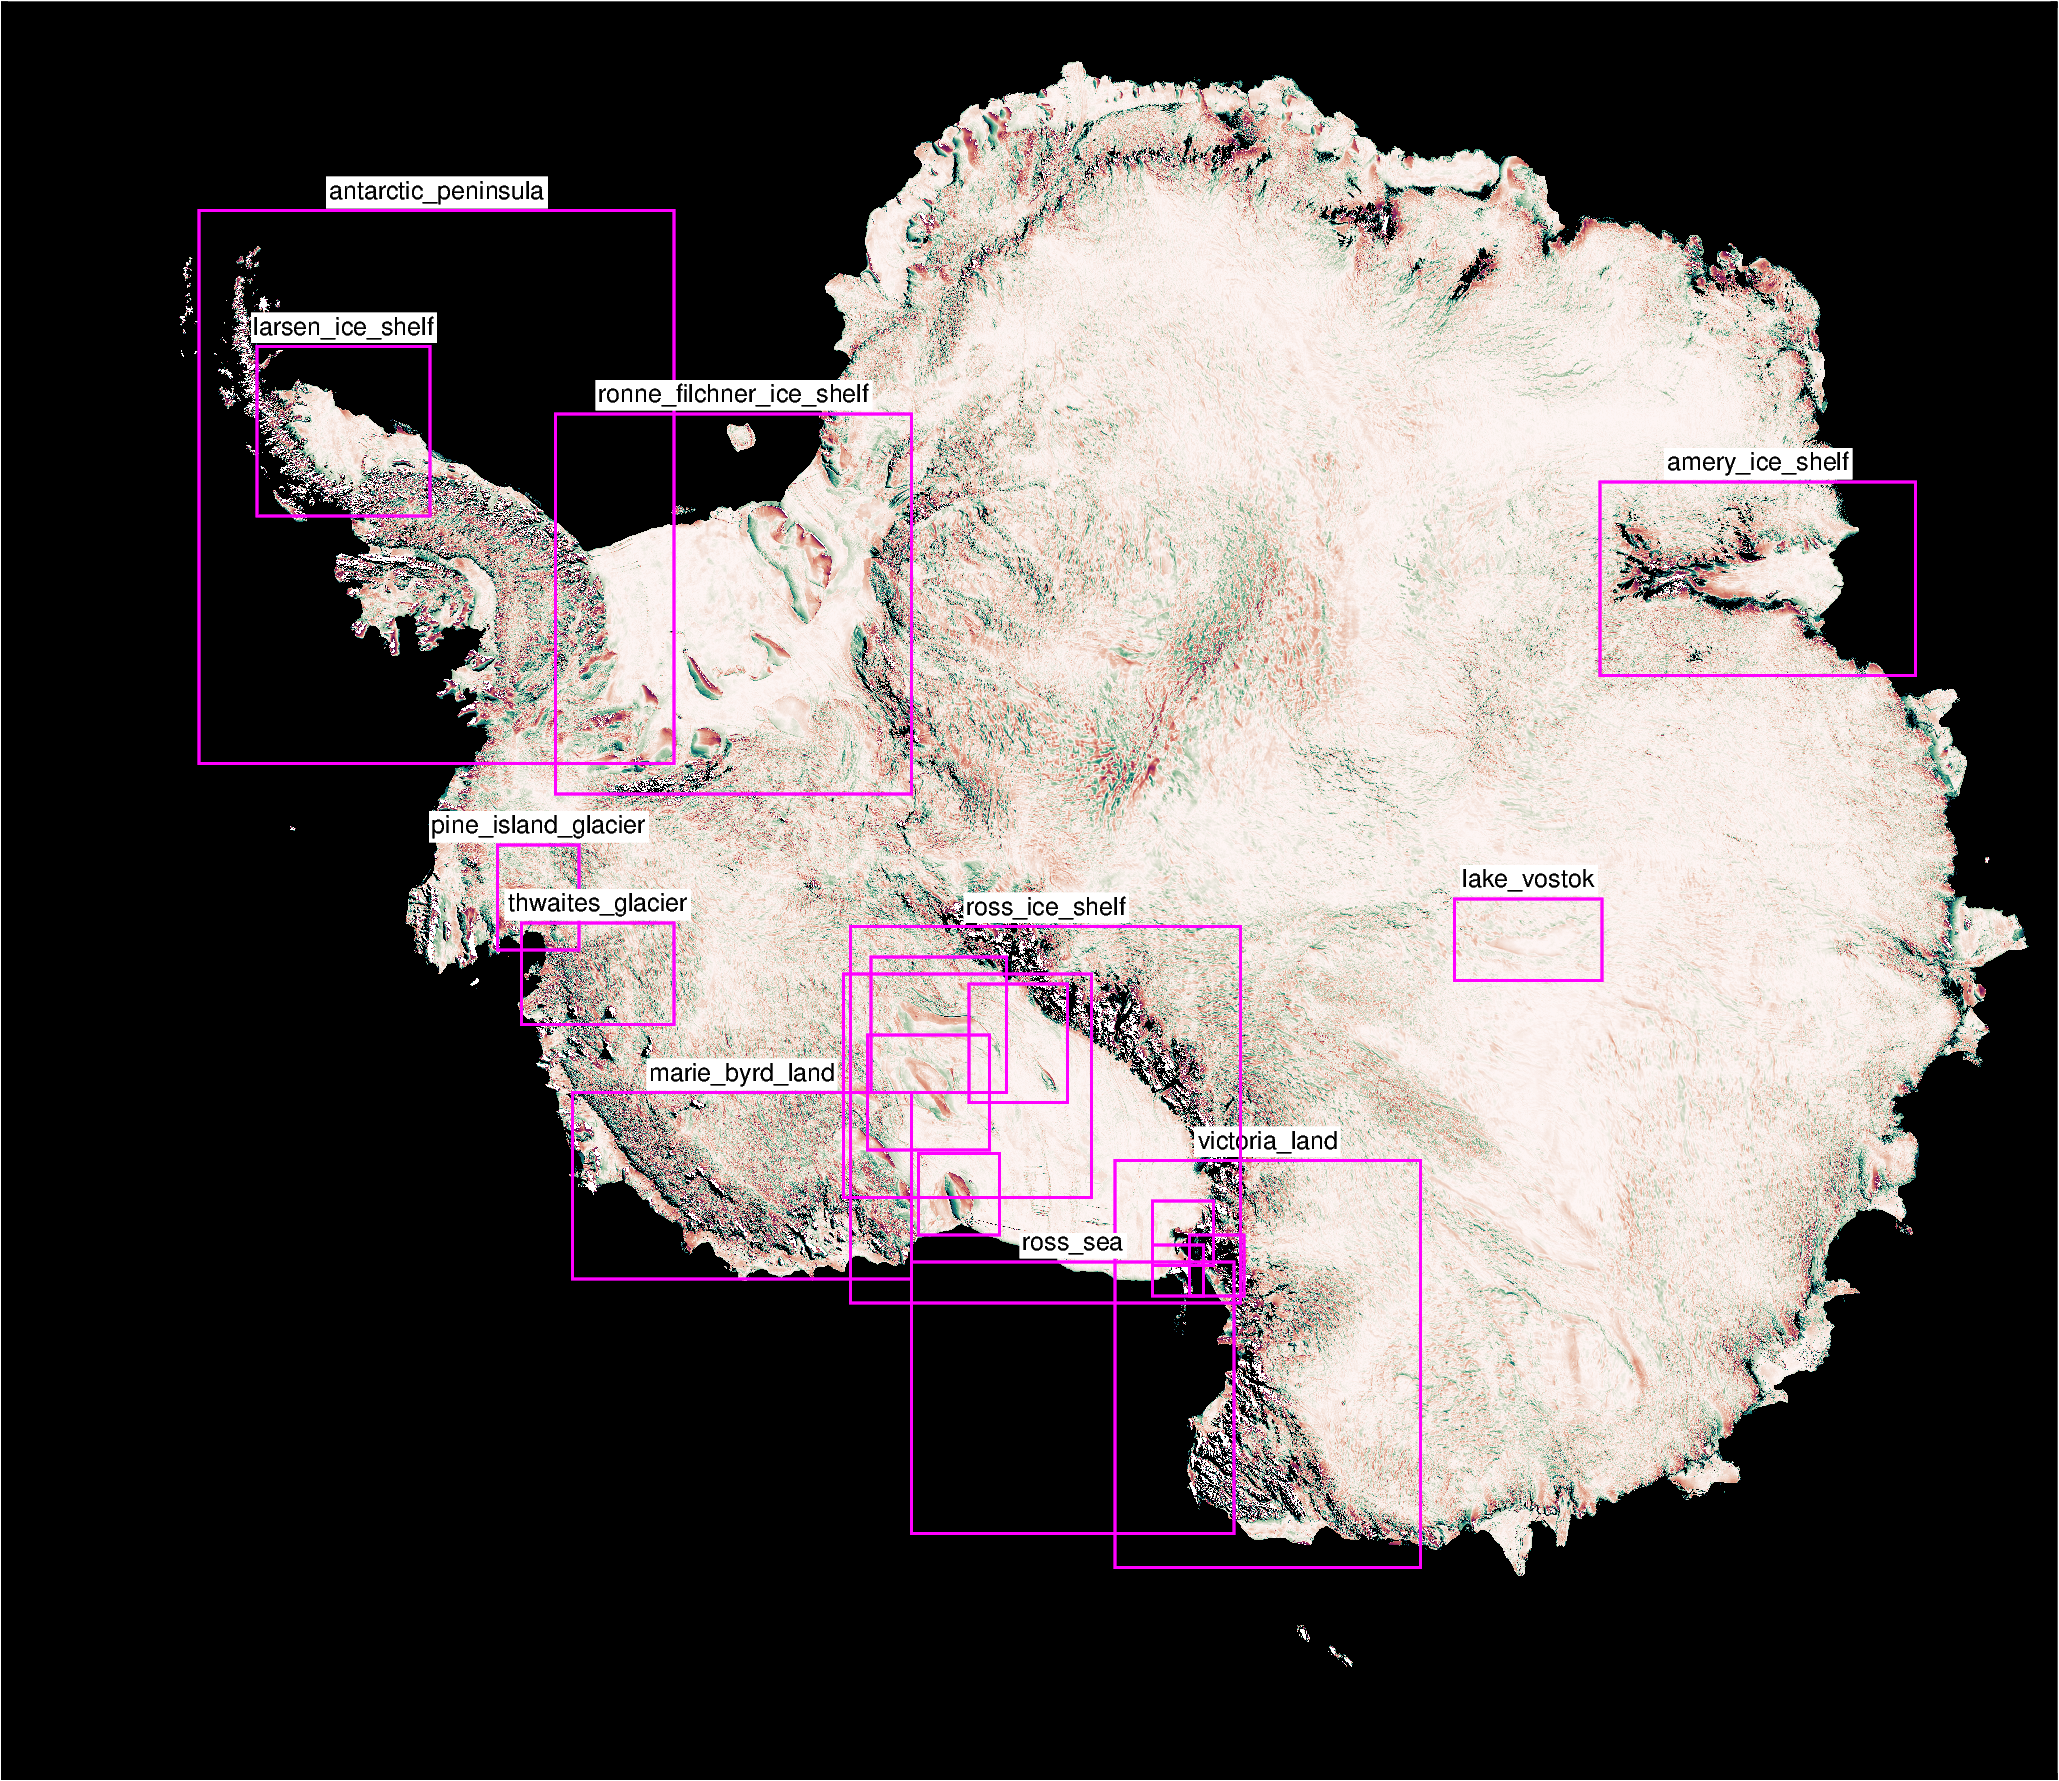
Display all the pre-defined regions#
[1]:
%%capture
%load_ext autoreload
%autoreload 2
from antarctic_plots import maps, regions, fetch, maps, utils
from statistics import mean
Add all region strings to dictionary
[2]:
region_dict = regions.get_regions()
region_dict
[2]:
{'antarctica': (-2800000.0, 2800000.0, -2800000.0, 2800000.0),
 'west_antarctica': (-2740000.0, 570000.0, -2150000.0, 1670000.0),
 'east_antarctica': (-840000.0, 2880000.0, -2400000.0, 2600000.0),
 'antarctic_peninsula': (-2600000.0, -1200000.0, 170000.0, 1800000.0),
 'marie_byrd_land': (-1500000.0, -500000.0, -1350000.0, -800000.0),
 'victoria_land': (100000.0, 1000000.0, -2200000.0, -1000000.0),
 'roosevelt_island': (-480000.0, -240000.0, -1220000.0, -980000.0),
 'ross_island': (210000.0, 360000.0, -1400000.0, -1250000.0),
 'minna_bluff': (210000.0, 390000.0, -1310000.0, -1120000.0),
 'mcmurdo_dry_valleys': (320000.0, 480000.0, -1400000.0, -1220000.0),
 'siple_coast': (-700000.0, 30000.0, -1110000.0, -450000.0),
 'crary_ice_rise': (-330000.0, -40000.0, -830000.0, -480000.0),
 'siple_dome': (-630000.0, -270000.0, -970000.0, -630000.0),
 'ross_ice_shelf': (-680000.0, 470000.0, -1420000.0, -310000.0),
 'larsen_ice_shelf': (-2430000.0, -1920000.0, 900000.0, 1400000.0),
 'ronne_filchner_ice_shelf': (-1550000.0, -500000.0, 80000.0, 1200000.0),
 'amery_ice_shelf': (1530000.0, 2460000.0, 430000.0, 1000000.0),
 'pine_island_glacier': (-1720000.0, -1480000.0, -380000.0, -70000.0),
 'thwaites_glacier': (-1650000.0, -1200000.0, -600000.0, -300000.0),
 'kamb_ice_stream': (-620000.0, -220000.0, -800000.0, -400000.0),
 'ross_sea': (-500000.0, 450000.0, -2100000.0, -1300000.0),
 'lake_vostok': (1100000.0, 1535000.0, -470000.0, -230000.0)}
Remove a few regions to help with plotting
[3]:
%%capture
remove = ["antarctica", "west_antarctica", "east_antarctica"]
[region_dict.pop(key) for key in remove]
Plot the remaining regions
[4]:
fig = maps.plot_grd(
    # grid=fetch.imagery(),
    grid=fetch.modis_moa(),
    image=True,
    cmap="curl",
)

for k, v in region_dict.items():
    maps.add_box(fig, v, pen=".6p,magenta")
    if k not in [
        "minna_bluff",
        "mcmurdo_dry_valleys",
        "siple_dome",
        "siple_coast",
        "roosevelt_island",
        "ross_island",
        "crary_ice_rise",
        "kamb_ice_stream",
    ]:
        fig.text(
            x=mean([v[1], v[0]]),
            y=v[3],
            text=k,
            justify="CB",
            offset="0/.1",
            no_clip=True,
            font="6p,Helvetica,black",
            fill="white",
        )

fig.show()
Warning 1: The definition of geographic CRS EPSG:4326 got from GeoTIFF keys is not the same as the one from the EPSG registry, which may cause issues during reprojection operations. Set GTIFF_SRS_SOURCE configuration option to EPSG to use official parameters (overriding the ones from GeoTIFF keys), or to GEOKEYS to use custom values from GeoTIFF keys and drop the EPSG code.
Warning 1: The definition of geographic CRS EPSG:4326 got from GeoTIFF keys is not the same as the one from the EPSG registry, which may cause issues during reprojection operations. Set GTIFF_SRS_SOURCE configuration option to EPSG to use official parameters (overriding the ones from GeoTIFF keys), or to GEOKEYS to use custom values from GeoTIFF keys and drop the EPSG code.
Warning 1: The definition of geographic CRS EPSG:4326 got from GeoTIFF keys is not the same as the one from the EPSG registry, which may cause issues during reprojection operations. Set GTIFF_SRS_SOURCE configuration option to EPSG to use official parameters (overriding the ones from GeoTIFF keys), or to GEOKEYS to use custom values from GeoTIFF keys and drop the EPSG code.
Warning 1: The definition of geographic CRS EPSG:4326 got from GeoTIFF keys is not the same as the one from the EPSG registry, which may cause issues during reprojection operations. Set GTIFF_SRS_SOURCE configuration option to EPSG to use official parameters (overriding the ones from GeoTIFF keys), or to GEOKEYS to use custom values from GeoTIFF keys and drop the EPSG code.
Warning 1: The definition of geographic CRS EPSG:4326 got from GeoTIFF keys is not the same as the one from the EPSG registry, which may cause issues during reprojection operations. Set GTIFF_SRS_SOURCE configuration option to EPSG to use official parameters (overriding the ones from GeoTIFF keys), or to GEOKEYS to use custom values from GeoTIFF keys and drop the EPSG code.
Warning 1: The definition of geographic CRS EPSG:4326 got from GeoTIFF keys is not the same as the one from the EPSG registry, which may cause issues during reprojection operations. Set GTIFF_SRS_SOURCE configuration option to EPSG to use official parameters (overriding the ones from GeoTIFF keys), or to GEOKEYS to use custom values from GeoTIFF keys and drop the EPSG code.
Warning 1: The definition of geographic CRS EPSG:4326 got from GeoTIFF keys is not the same as the one from the EPSG registry, which may cause issues during reprojection operations. Set GTIFF_SRS_SOURCE configuration option to EPSG to use official parameters (overriding the ones from GeoTIFF keys), or to GEOKEYS to use custom values from GeoTIFF keys and drop the EPSG code.
WARNING:root:grid registration not extracted, re-trying with file loaded as xarray grid
WARNING:rasterio._env:CPLE_AppDefined in The definition of geographic CRS EPSG:4326 got from GeoTIFF keys is not the same as the one from the EPSG registry, which may cause issues during reprojection operations. Set GTIFF_SRS_SOURCE configuration option to EPSG to use official parameters (overriding the ones from GeoTIFF keys), or to GEOKEYS to use custom values from GeoTIFF keys and drop the EPSG code.
Warning 1: The definition of geographic CRS EPSG:4326 got from GeoTIFF keys is not the same as the one from the EPSG registry, which may cause issues during reprojection operations. Set GTIFF_SRS_SOURCE configuration option to EPSG to use official parameters (overriding the ones from GeoTIFF keys), or to GEOKEYS to use custom values from GeoTIFF keys and drop the EPSG code.
Warning 1: The definition of geographic CRS EPSG:4326 got from GeoTIFF keys is not the same as the one from the EPSG registry, which may cause issues during reprojection operations. Set GTIFF_SRS_SOURCE configuration option to EPSG to use official parameters (overriding the ones from GeoTIFF keys), or to GEOKEYS to use custom values from GeoTIFF keys and drop the EPSG code.
Warning 1: The definition of geographic CRS EPSG:4326 got from GeoTIFF keys is not the same as the one from the EPSG registry, which may cause issues during reprojection operations. Set GTIFF_SRS_SOURCE configuration option to EPSG to use official parameters (overriding the ones from GeoTIFF keys), or to GEOKEYS to use custom values from GeoTIFF keys and drop the EPSG code.
Warning 1: The definition of geographic CRS EPSG:4326 got from GeoTIFF keys is not the same as the one from the EPSG registry, which may cause issues during reprojection operations. Set GTIFF_SRS_SOURCE configuration option to EPSG to use official parameters (overriding the ones from GeoTIFF keys), or to GEOKEYS to use custom values from GeoTIFF keys and drop the EPSG code.
Warning 1: The definition of geographic CRS EPSG:4326 got from GeoTIFF keys is not the same as the one from the EPSG registry, which may cause issues during reprojection operations. Set GTIFF_SRS_SOURCE configuration option to EPSG to use official parameters (overriding the ones from GeoTIFF keys), or to GEOKEYS to use custom values from GeoTIFF keys and drop the EPSG code.
Combining regions#
[14]:
# define two regions
RIS = regions.ross_ice_shelf
MBL = regions.marie_byrd_land

# get the bounding region of both
combined = regions.combine_regions(RIS, MBL)

# make a basemap
fig = maps.plot_grd(
    fetch.bedmap2(layer="bed"),
    region=regions.antarctica,
    colorbar=False,
    title="Combining regions",
)
# plot the three regions
maps.add_box(fig, combined, pen="6p,red")
maps.add_box(fig, RIS)
maps.add_box(fig, MBL)

fig.show()

Interactively choose a region#
This use the package ipyleaflet, which isn’t install automatically with antarctic-plots. Install it with mamba install ipyleaflet
The below cell will display an interactive map of Antarctica. Drag or zoom to your region of interest and use the Draw a polygon button to create a polygon outline the region you want.
[47]:
polygon = regions.draw_region()
[48]:
# get the bounding region of the polygon
region = utils.polygon_to_region(polygon)
region
[48]:
(-231126.51921880982,
 88540.46702791154,
 1796446.6390824455,
 2263397.8642284973)
[52]:
# use it to create a map
maps.plot_grd(
    fetch.ice_vel(region=region, verbose="q"),
    region=region,
    cmap="plasma",
    grd2cpt=True,
    inset=True,
    cbar_label="MEaSUREs ice velocity",
    cbar_unit="m/yr",
    coast=True,
    scalebar=True,
    scalebar_box="+gwhite",
)
mapproject [WARNING]: For a UTM or TM projection, your region -231126.51921880982/88540.46702791154/1796446.6390824455/2263397.8642284973 is too large to be in degrees and thus assumed to be in meters
colorbar [WARNING]: For a UTM or TM projection, your region -231126.51921880982/88540.46702791154/1796446.6390824455/2263397.8642284973 is too large to be in degrees and thus assumed to be in meters
[52]:

[ ]: