A simple map#
Here we will showcase a few ways to make a simple map. We’ll download some ice thickness data from BedMap2 for the Amery Ice Shelf.
Import the modules
[1]:
%%capture
%load_ext autoreload
%autoreload 2

from antarctic_plots import maps, fetch, regions, utils
Use the Antarctic-Plots fetch module to download the data and return the grid as an xarray.DataArrays
[2]:
ice_thickness = fetch.bedmap2(
    layer="thickness",  # choose which layer to plot (e.g. 'surface', 'bed', 'icebase')
    region=regions.amery_ice_shelf,  # choose a pre-defined region, or set your own
    # fill_nans=True,  # fill no data values with 0
)
Create a simple map with default settings
[3]:
fig = maps.plot_grd(ice_thickness)

fig.show()
/home/matt/antarctic_plots/src/antarctic_plots/maps.py:602: SyntaxWarning: Short-form parameter (Q) is not recommended. Use long-form parameter 'log' instead.
  fig.colorbar(

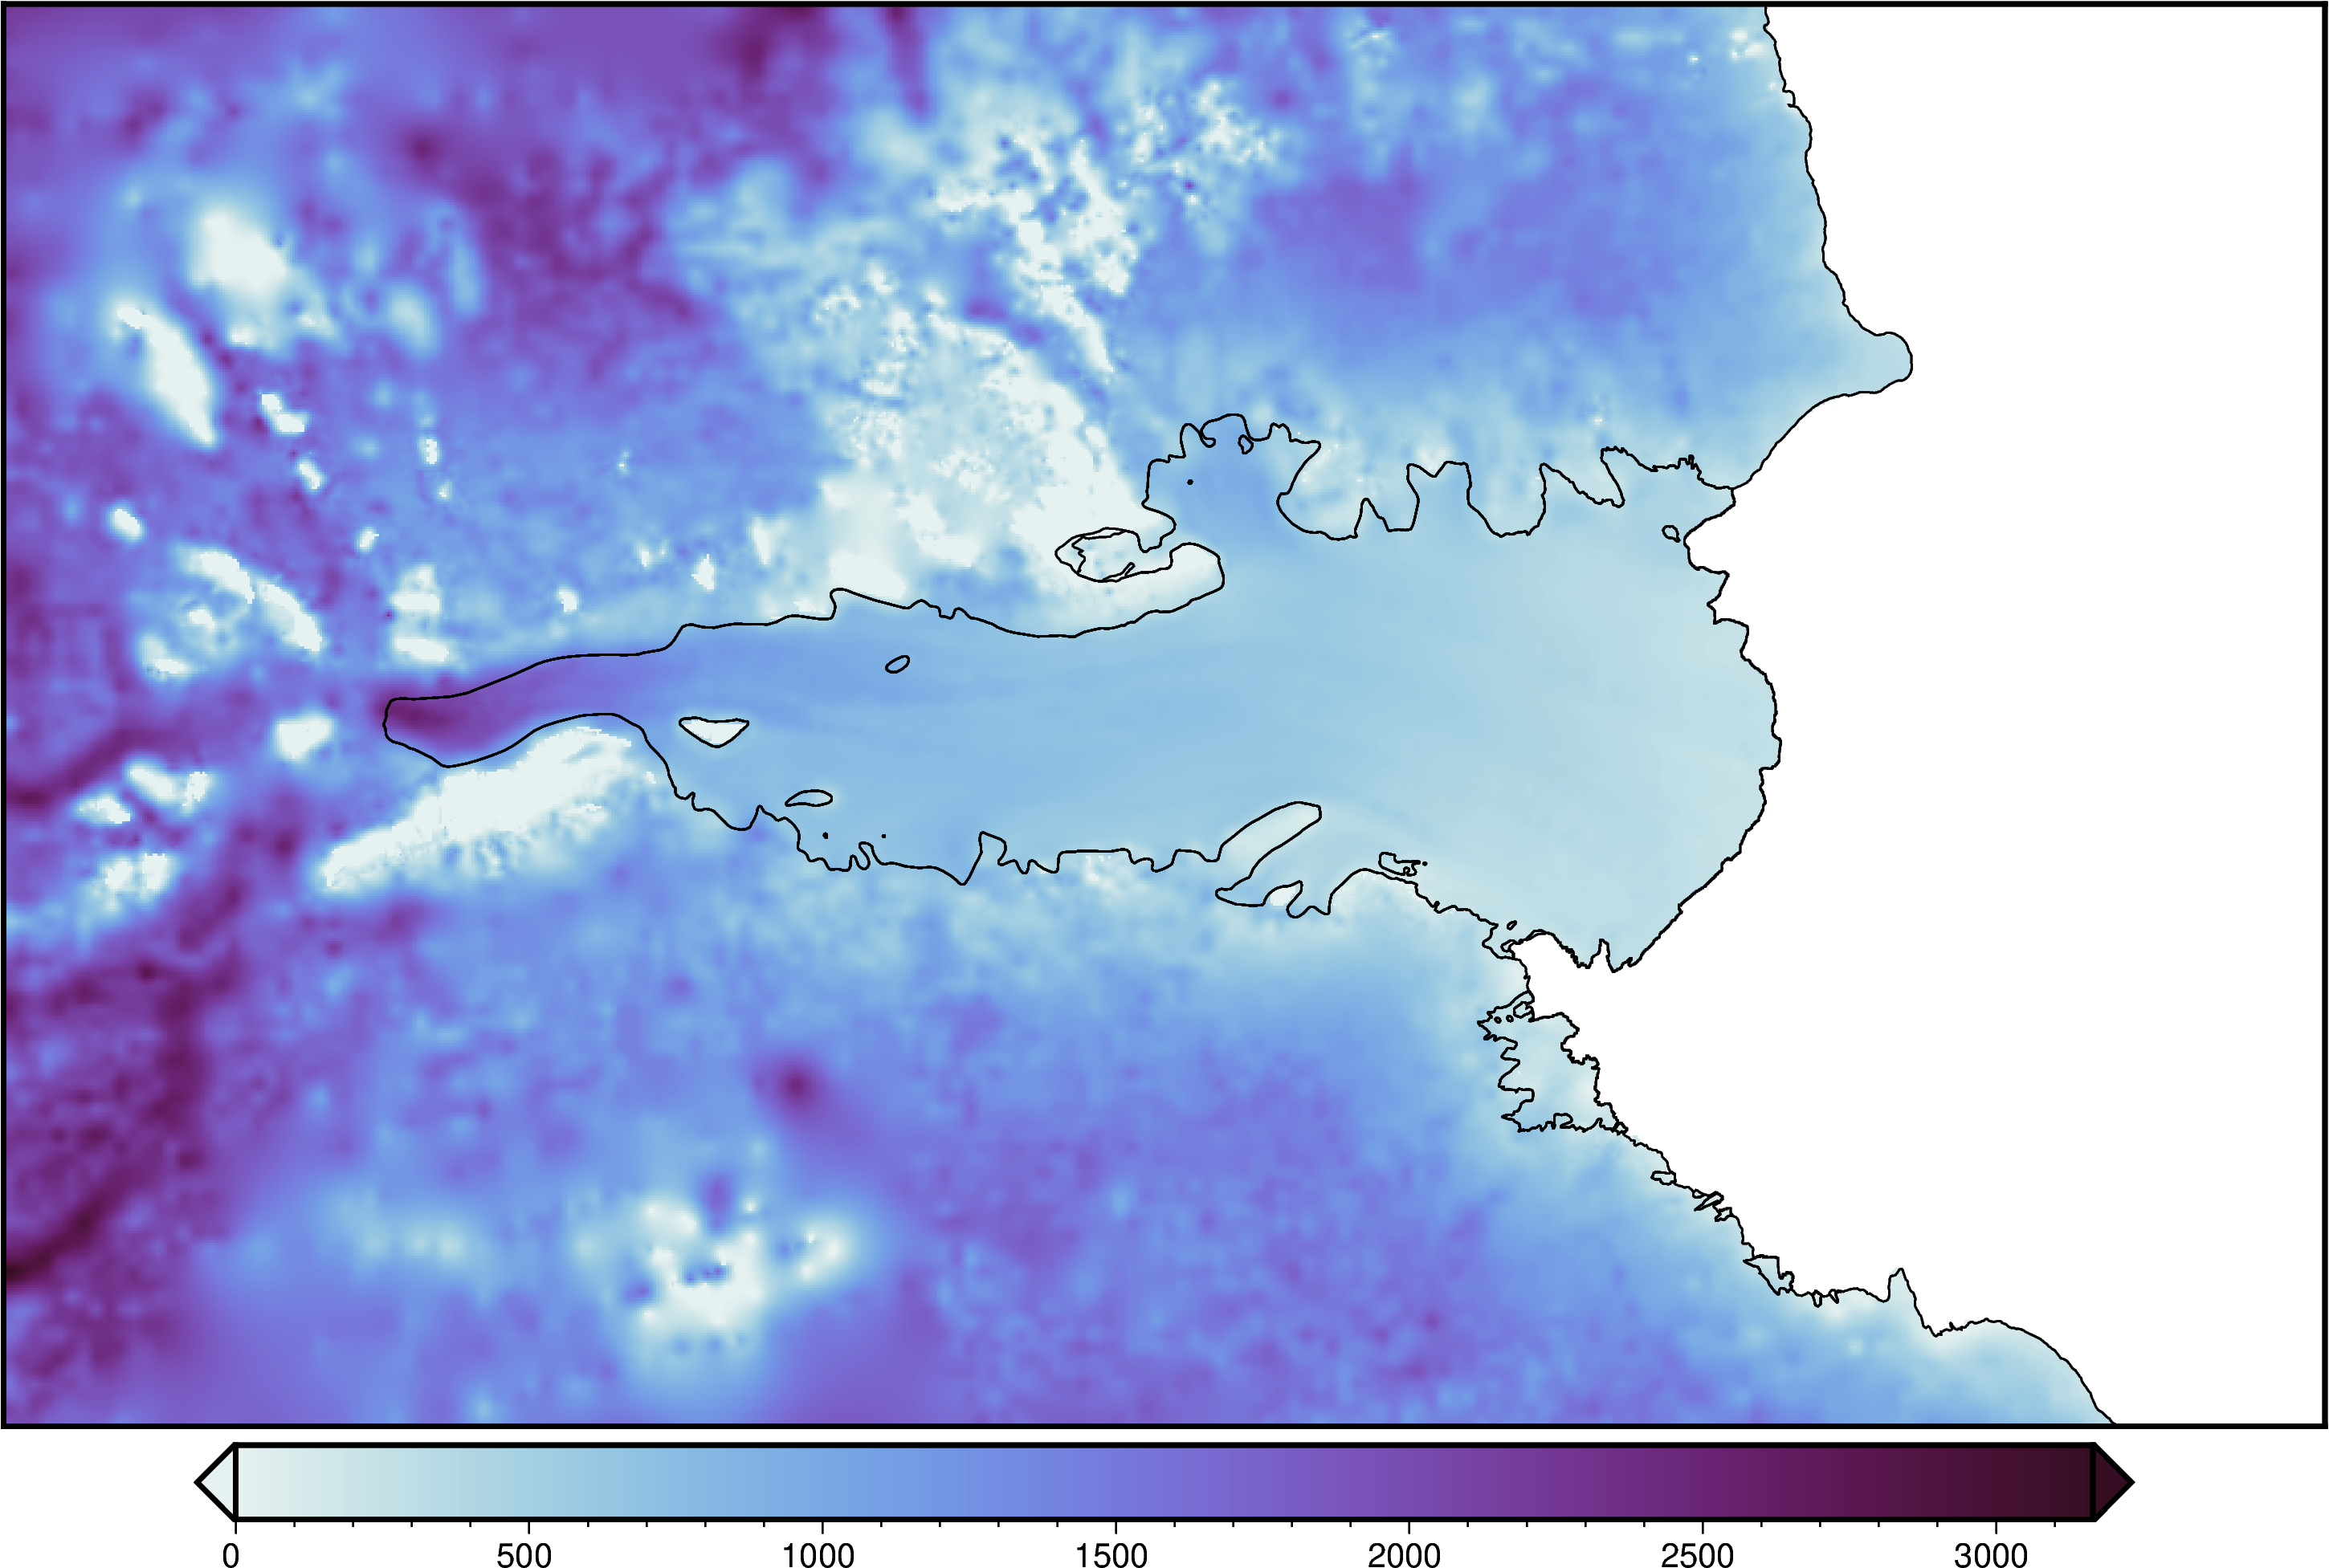
Change the colorscale (see available options at https://docs.generic-mapping-tools.org/6.2/cookbook/cpts.html) and add the coastline / groundingline
[4]:
fig = maps.plot_grd(
    ice_thickness,
    cmap="dense",
)

# add the coastline and groundingline
maps.add_coast(fig)

fig.show()
/home/matt/antarctic_plots/src/antarctic_plots/maps.py:602: SyntaxWarning: Short-form parameter (Q) is not recommended. Use long-form parameter 'log' instead.
  fig.colorbar(
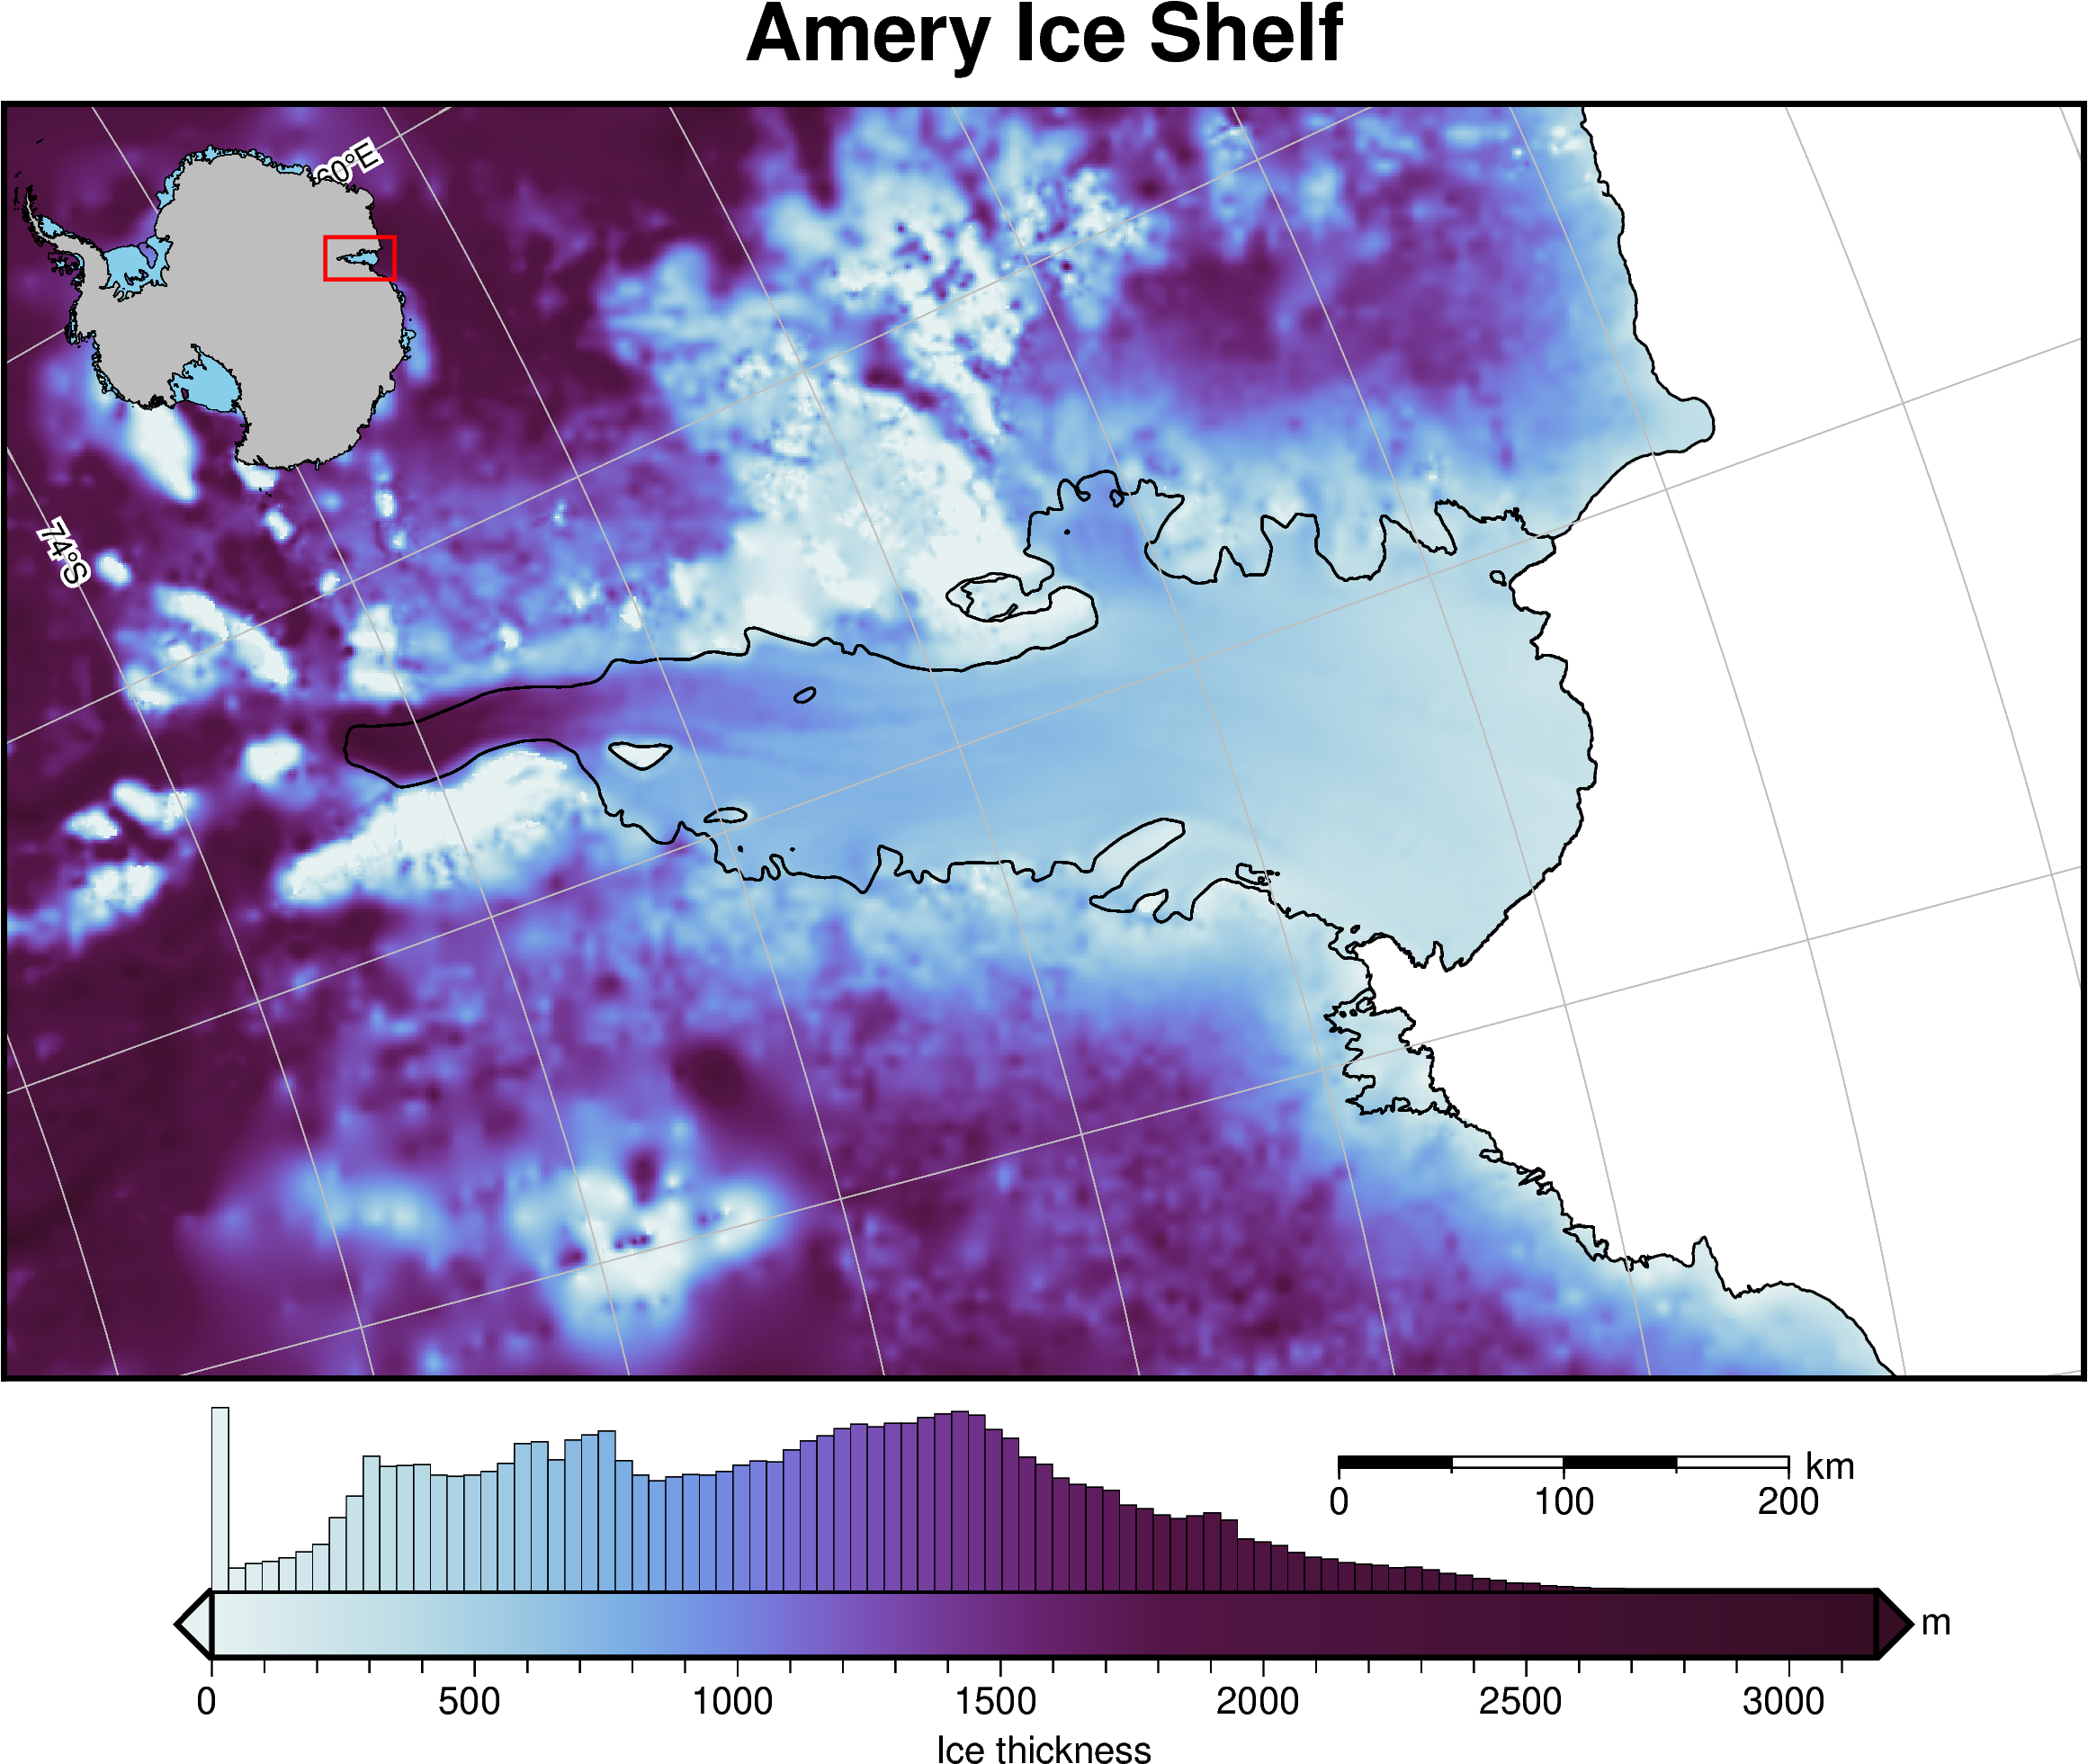
Add additional features to the plot, all within the plot_grd() function
[9]:
fig = maps.plot_grd(
    ice_thickness,
    fig_height=12,  # set figure height
    cmap="dense",  # set the colormap
    grd2cpt=True,  #
    coast=True,  # plot grounding and coastlines
    title="Amery Ice Shelf",
    cbar_label="Ice thickness",  # add label to colorbar
    cbar_unit="m",  # add units to y-axis of colorbar
    inset=True,  #  add inset map showing location
    inset_width=0.2,
    scalebar=True,  # add scalebar
    scale_position="n.75/-.07",
    gridlines=True,  # add lat/lon gridlines
    x_spacing=10,  # longitude interval (degrees)
    y_spacing=2,  # latitude interval (degrees)
    hist=True,  # add a histogram to the colorbar
    hist_bin_num=100,  # 100 bins
)

# display the figure
fig.show()
grd2cpt [ERROR]: Making a continuous cpt from a discrete cpt may give unexpected results!
gmtset [WARNING]: Representation of font type not recognized. Using default.
mapproject [WARNING]: For a UTM or TM projection, your region 1530000.0/2460000.0/430000.0/1000000.0 is too large to be in degrees and thus assumed to be in meters
mapproject [WARNING]: For a UTM or TM projection, your region 1530000.0/2460000.0/430000.0/1000000.0 is too large to be in degrees and thus assumed to be in meters
colorbar [WARNING]: For a UTM or TM projection, your region 1530000.0/2460000.0/430000.0/1000000.0 is too large to be in degrees and thus assumed to be in meters
[ ]: