Use with PyGMT#
Here we demonstrate how to use the figure output from maps.plot_grd() with normal PyGMT commands.
Import the modules
[1]:
%%capture
%load_ext autoreload
%autoreload 2

from antarctic_plots import maps, fetch
Fetch the datasets, bedmap2 surface topography and LIMA satellite imagery
[2]:
imagery = fetch.imagery()

surface = fetch.bedmap2(layer="surface")
[3]:
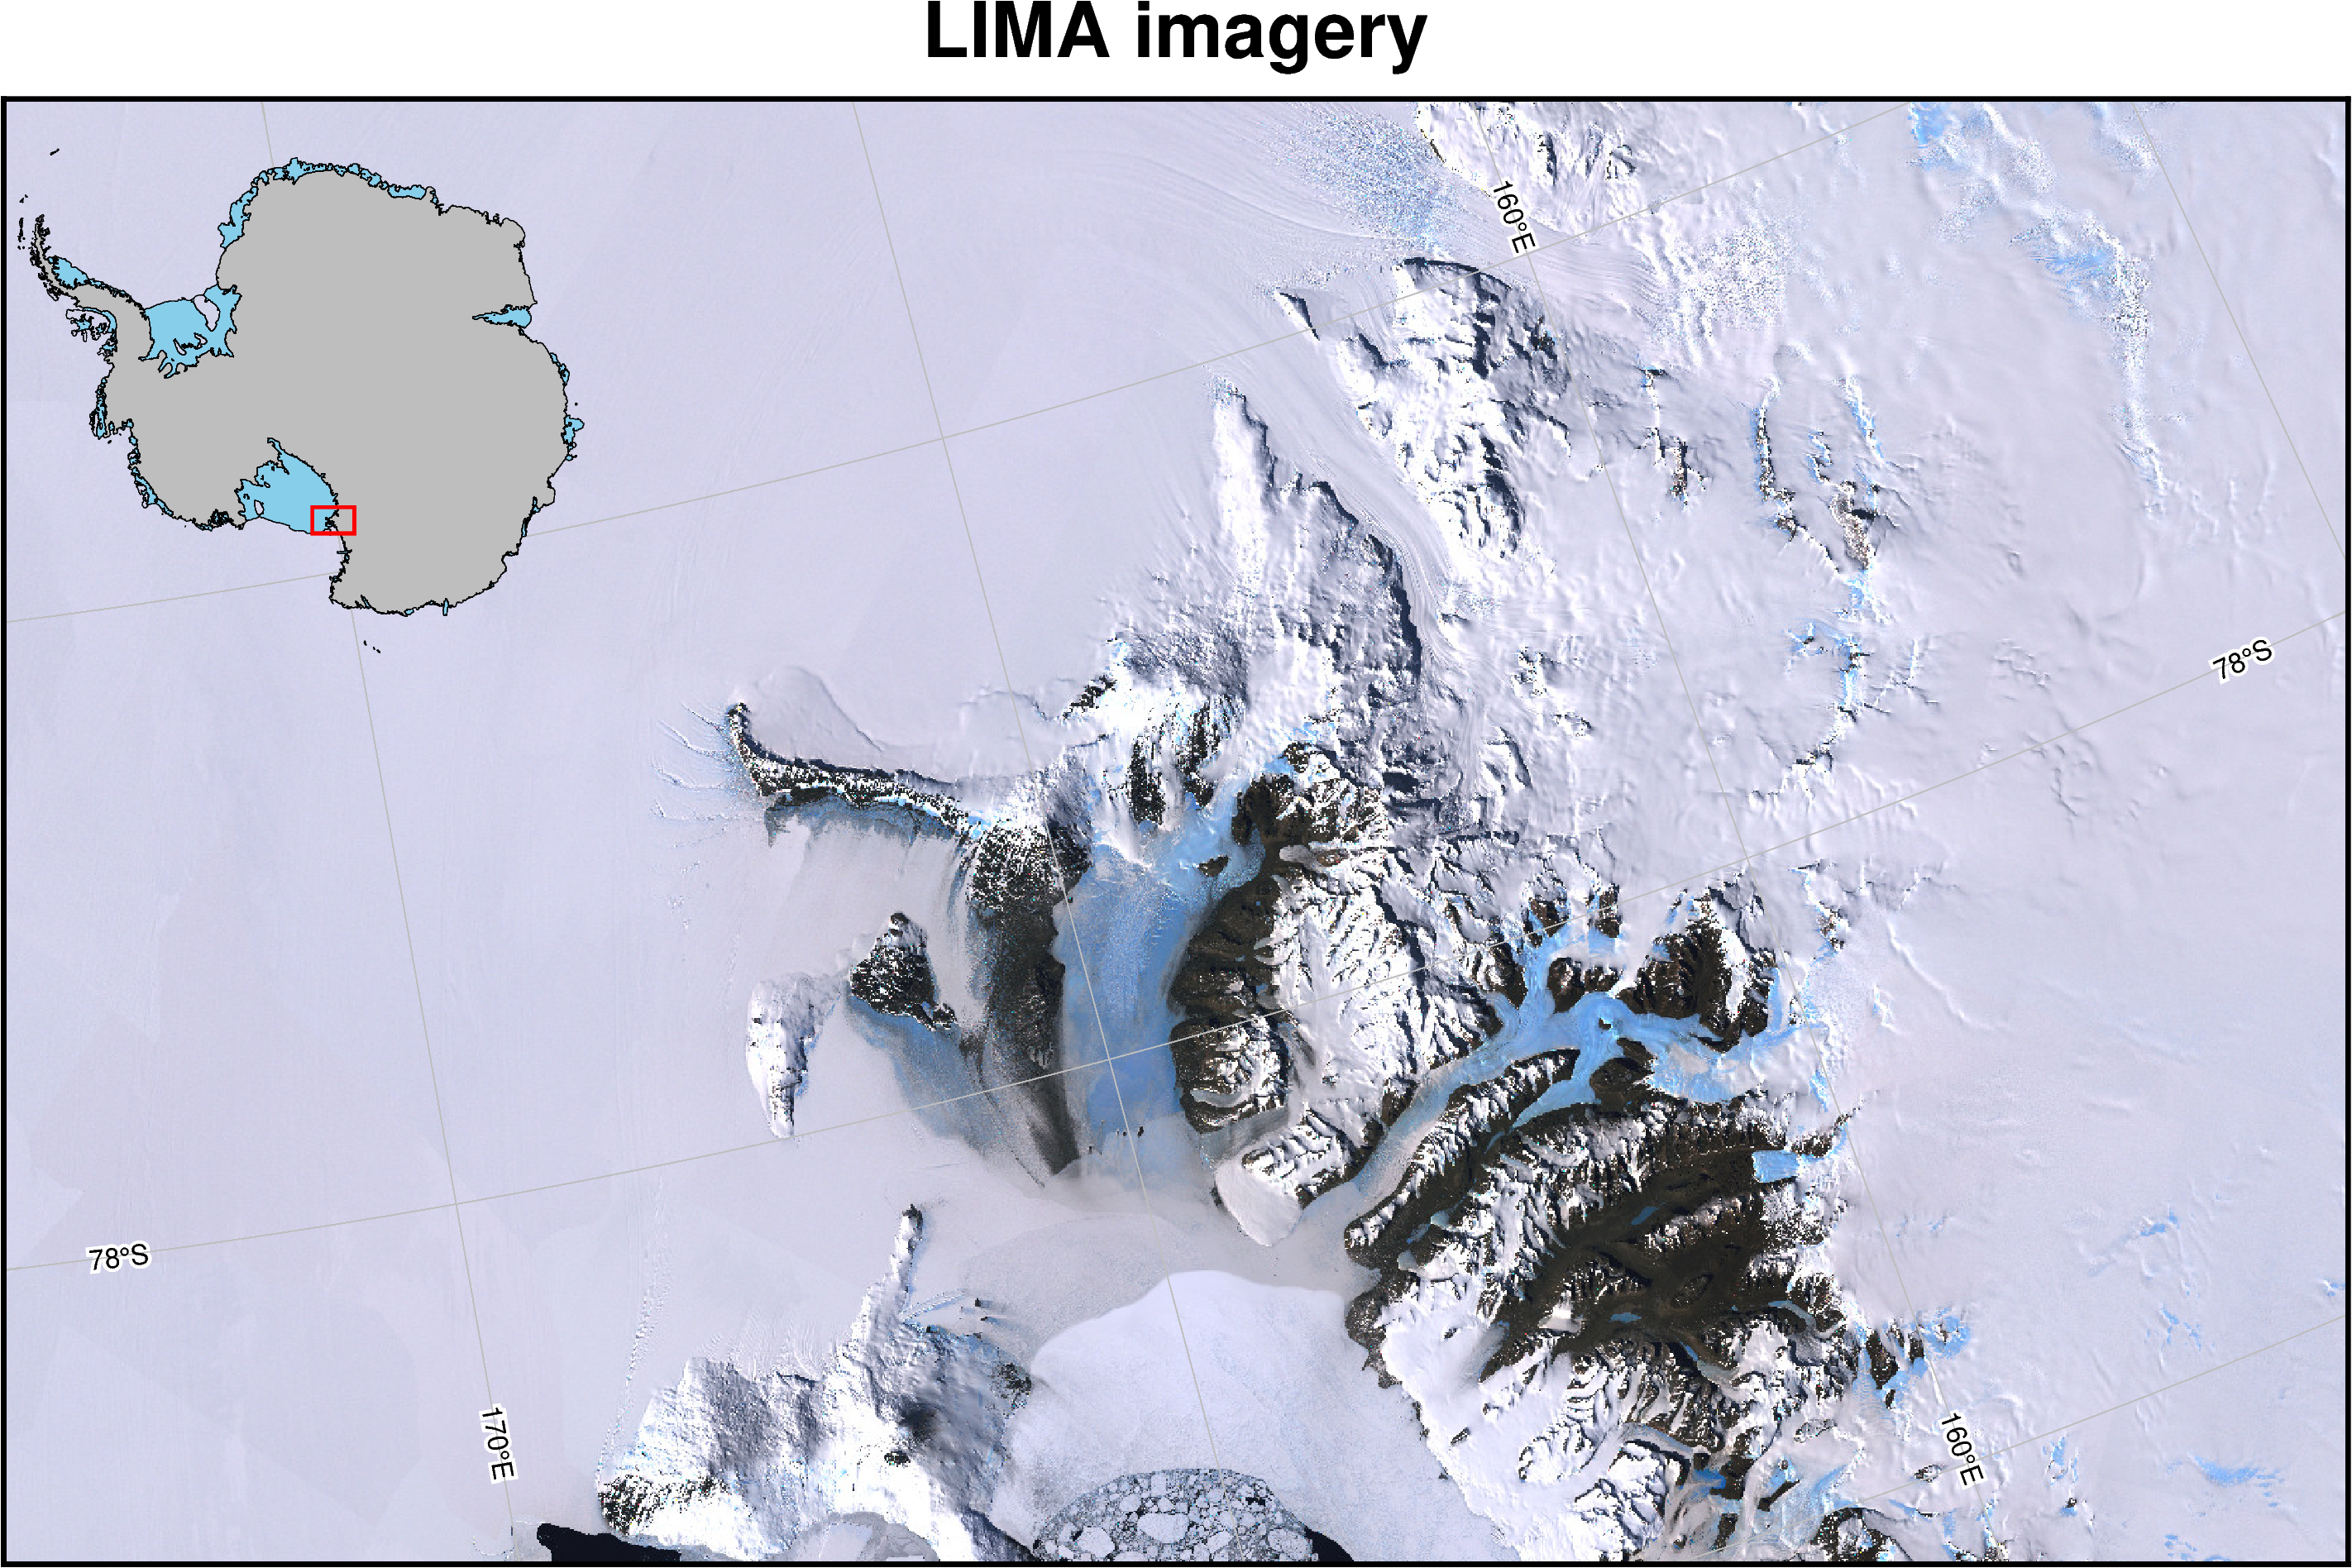
# define the region of interest
region = (150e3, 550e3, -1350e3, -1100e3)

# plot the imagery and some additonal map features
fig = maps.plot_grd(
    imagery,
    region=region,
    image=True,
    inset=True,
    title="LIMA imagery",
    gridlines=True,
    x_spacing=10,  # plot 10 degree longitude lines
    y_spacing=2,  # plot 2 degree latitude lines
)

fig.show()
gmtset [WARNING]: Representation of font type not recognized. Using default.
mapproject [WARNING]: For a UTM or TM projection, your region 150000.0/550000.0/-1350000.0/-1100000.0 is too large to be in degrees and thus assumed to be in meters
Use additional PyGMT plotting methods on the figure
[5]:
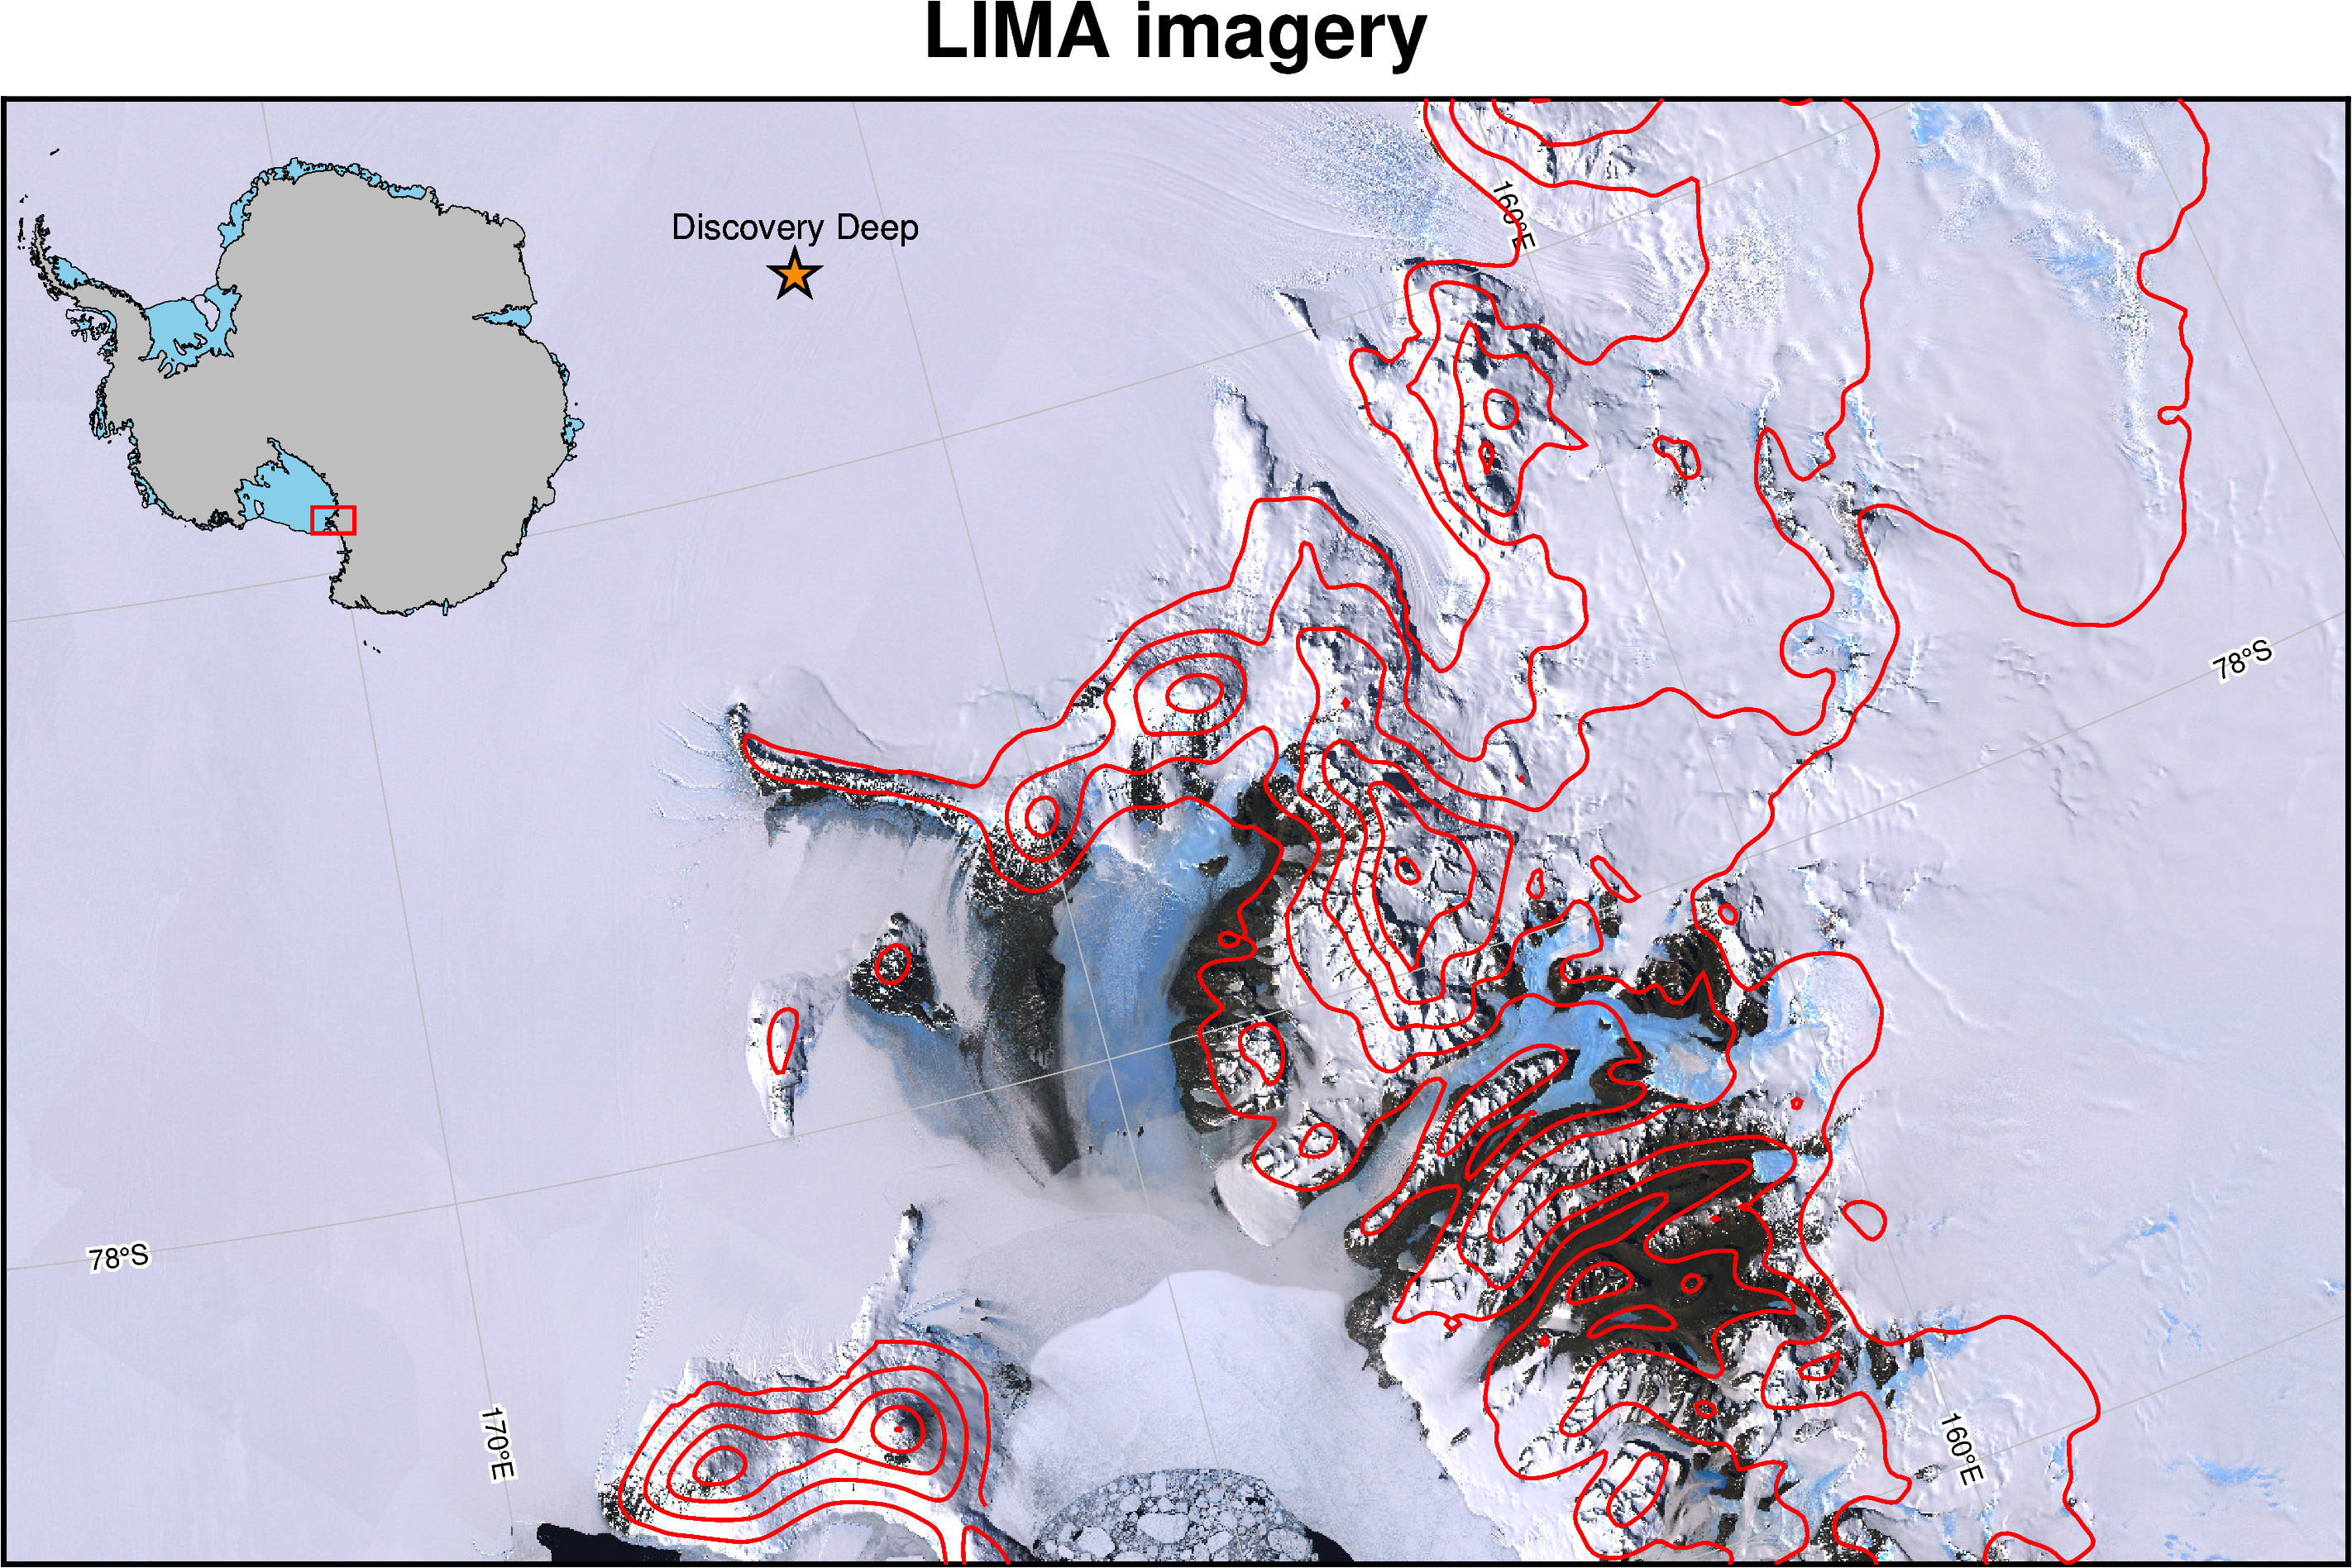
# add surface elevation contours
fig.grdcontour(grid=surface, interval=500, pen="thick,red")

# add a point and label
fig.plot(x=285000, y=-1130000, style="a0.5c", pen="1p,black", fill="darkorange")
fig.text(x=285000, y=-1130000, text="Discovery Deep", offset="0c/.5c")

# show the figure
fig.show()
[ ]: