Tips for choosing profile locations#
To help you pick the locations of your profiles, here are a few resources.
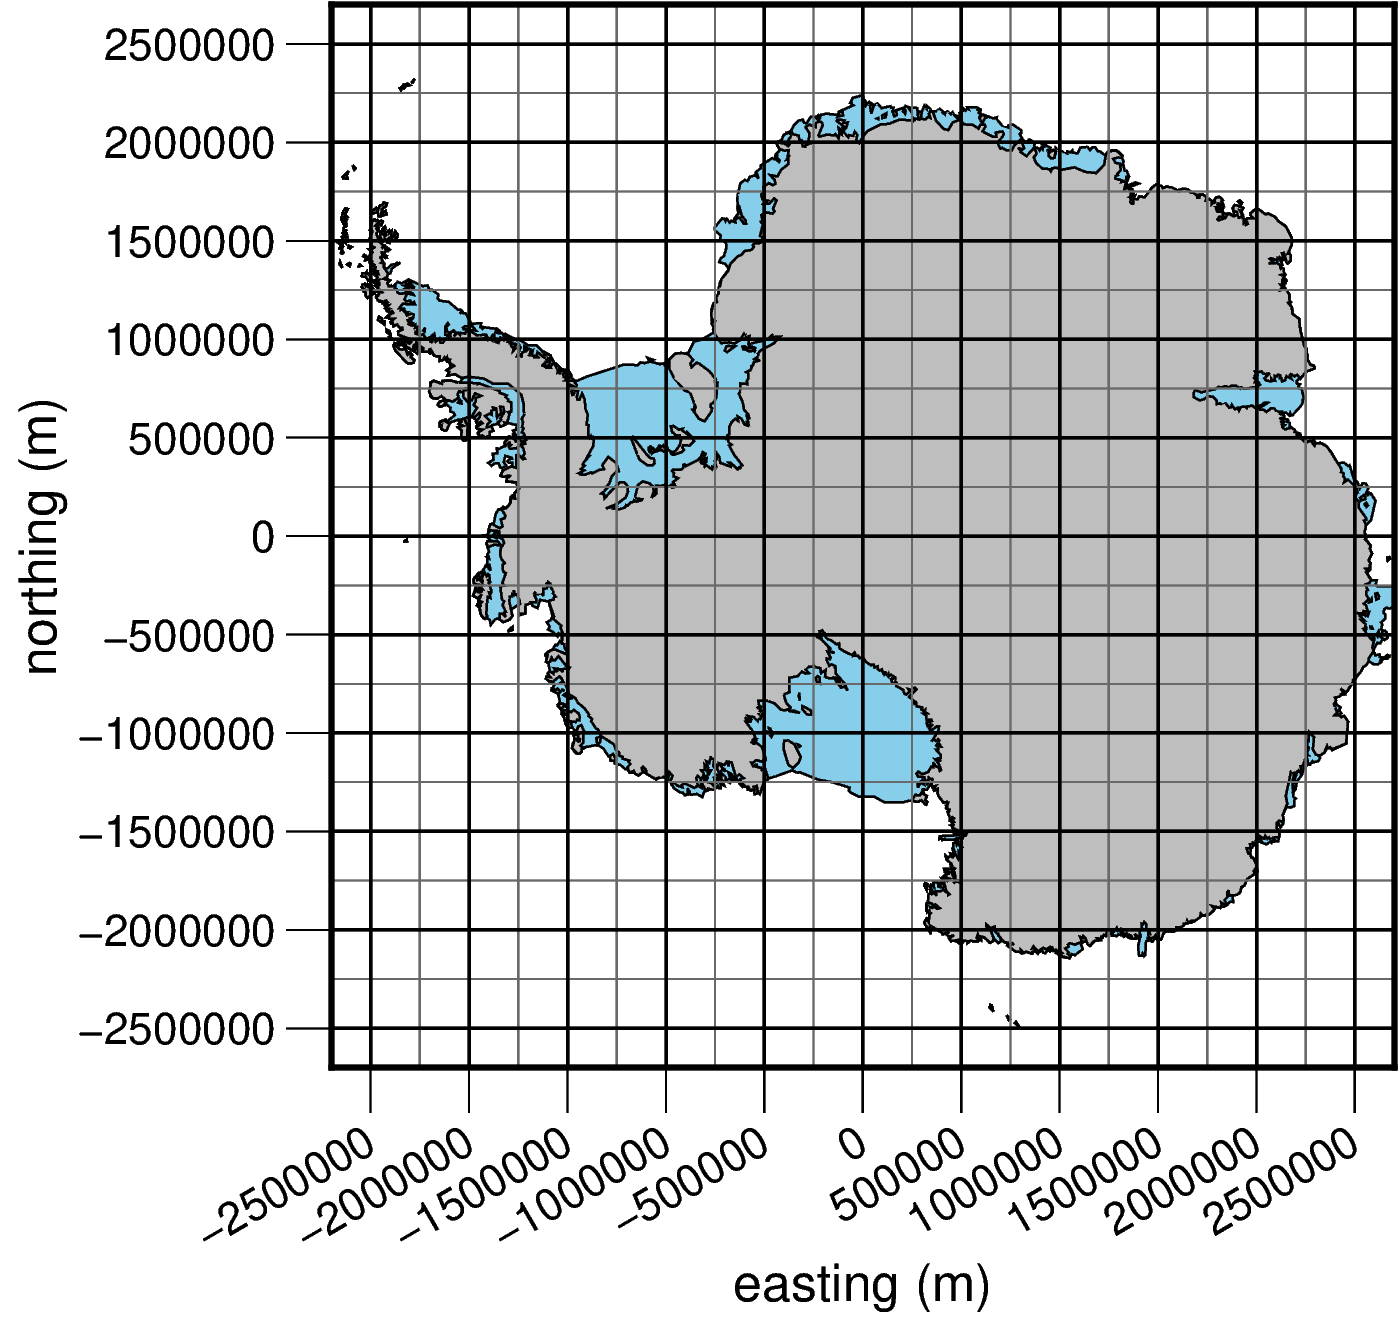
EPSG:3031 Polar Stereographic map#
Read x/y coordinates off this map to choose approximate start/end profile points.
[1]:
import pygmt

fig = pygmt.Figure()
region = (-2700000, 2700000, -2700000, 2700000)
e, w, n, s = region
fig_height = 90  # in mm
fig_width = fig_height * (w - e) / (s - n)
fig_ratio = (s - n) / (fig_height / 1000)
fig_proj = "x1:" + str(fig_ratio)
fig_proj_ll = "s0/-90/-71/1:" + str(fig_ratio)

fig.coast(
    region=region, projection=fig_proj_ll, shorelines="0.5p,black", land="skyblue"
)
fig.coast(
    projection=fig_proj_ll, area_thresh="+ag", shorelines="0.5p,black", land="gray"
)

with pygmt.config(
    MAP_GRID_PEN_PRIMARY=".4p,dimgray", MAP_GRID_PEN_SECONDARY=".75p,black"
):
    fig.basemap(
        projection=fig_proj,
        frame=[
            "sxa500000g500000+a30+leasting (m)",
            "pxg250000",
            "sya500000g500000+lnorthing (m)",
            "pyg250000",
        ],
    )
fig.show()
C:\Users\matthewt\AppData\Local\miniforge3\envs\antarctic_plots_dev\lib\site-packages\xarray\backends\cfgrib_.py:29: UserWarning: Failed to load cfgrib - most likely there is a problem accessing the ecCodes library. Try `import cfgrib` to get the full error message
  warnings.warn(
coast [WARNING]: For a UTM or TM projection, your region -2700000/2700000/-2700000/2700000 is too large to be in degrees and thus assumed to be in meters
coast [WARNING]: For a UTM or TM projection, your region -2700000/2700000/-2700000/2700000 is too large to be in degrees and thus assumed to be in meters
Or if you install ipyleaflet with mamba install ipyleaflet, the below code wil show and interactive map and clicking will give coordinates in EPSG 3031. See the tutorial profile walkthrough for an example of extracting a profile from the interactive map, or tutorial regions_walkthrough for an example of defining a region from the interactive map.
[1]:
from antarctic_plots import maps

m = maps.interactive_map()
c:\Users\matthewt\AppData\Local\miniforge3\envs\antarctic_plots_test\lib\site-packages\xarray\backends\cfgrib_.py:29: UserWarning: Failed to load cfgrib - most likely there is a problem accessing the ecCodes library. Try `import cfgrib` to get the full error message
  warnings.warn(
Make custom shapefile in QGIS#
QGIS, especially with the Quantarctica package, is an easy way to make a custom shapefile. This can then be used with antarctic_plots to sample data along the file.
To make the shapefile in QGIS: * Layer -> Create Layer -> New Shapefile Layer * For Geometry Type, select Polygon * Select EPSG:3031 for the coordinate reference system * Save to the same directory as your python file you want to work with.