Antarctic-plots
Contents
Antarctic-plots#
Functions to automate Antarctic data visualization
Disclaimer#
🚨 This package is in early stages of design and implementation. 🚨
I welcome any feedback, ideas, or contributions! Please submit an issue on Github for problems or feature ideas.
About#
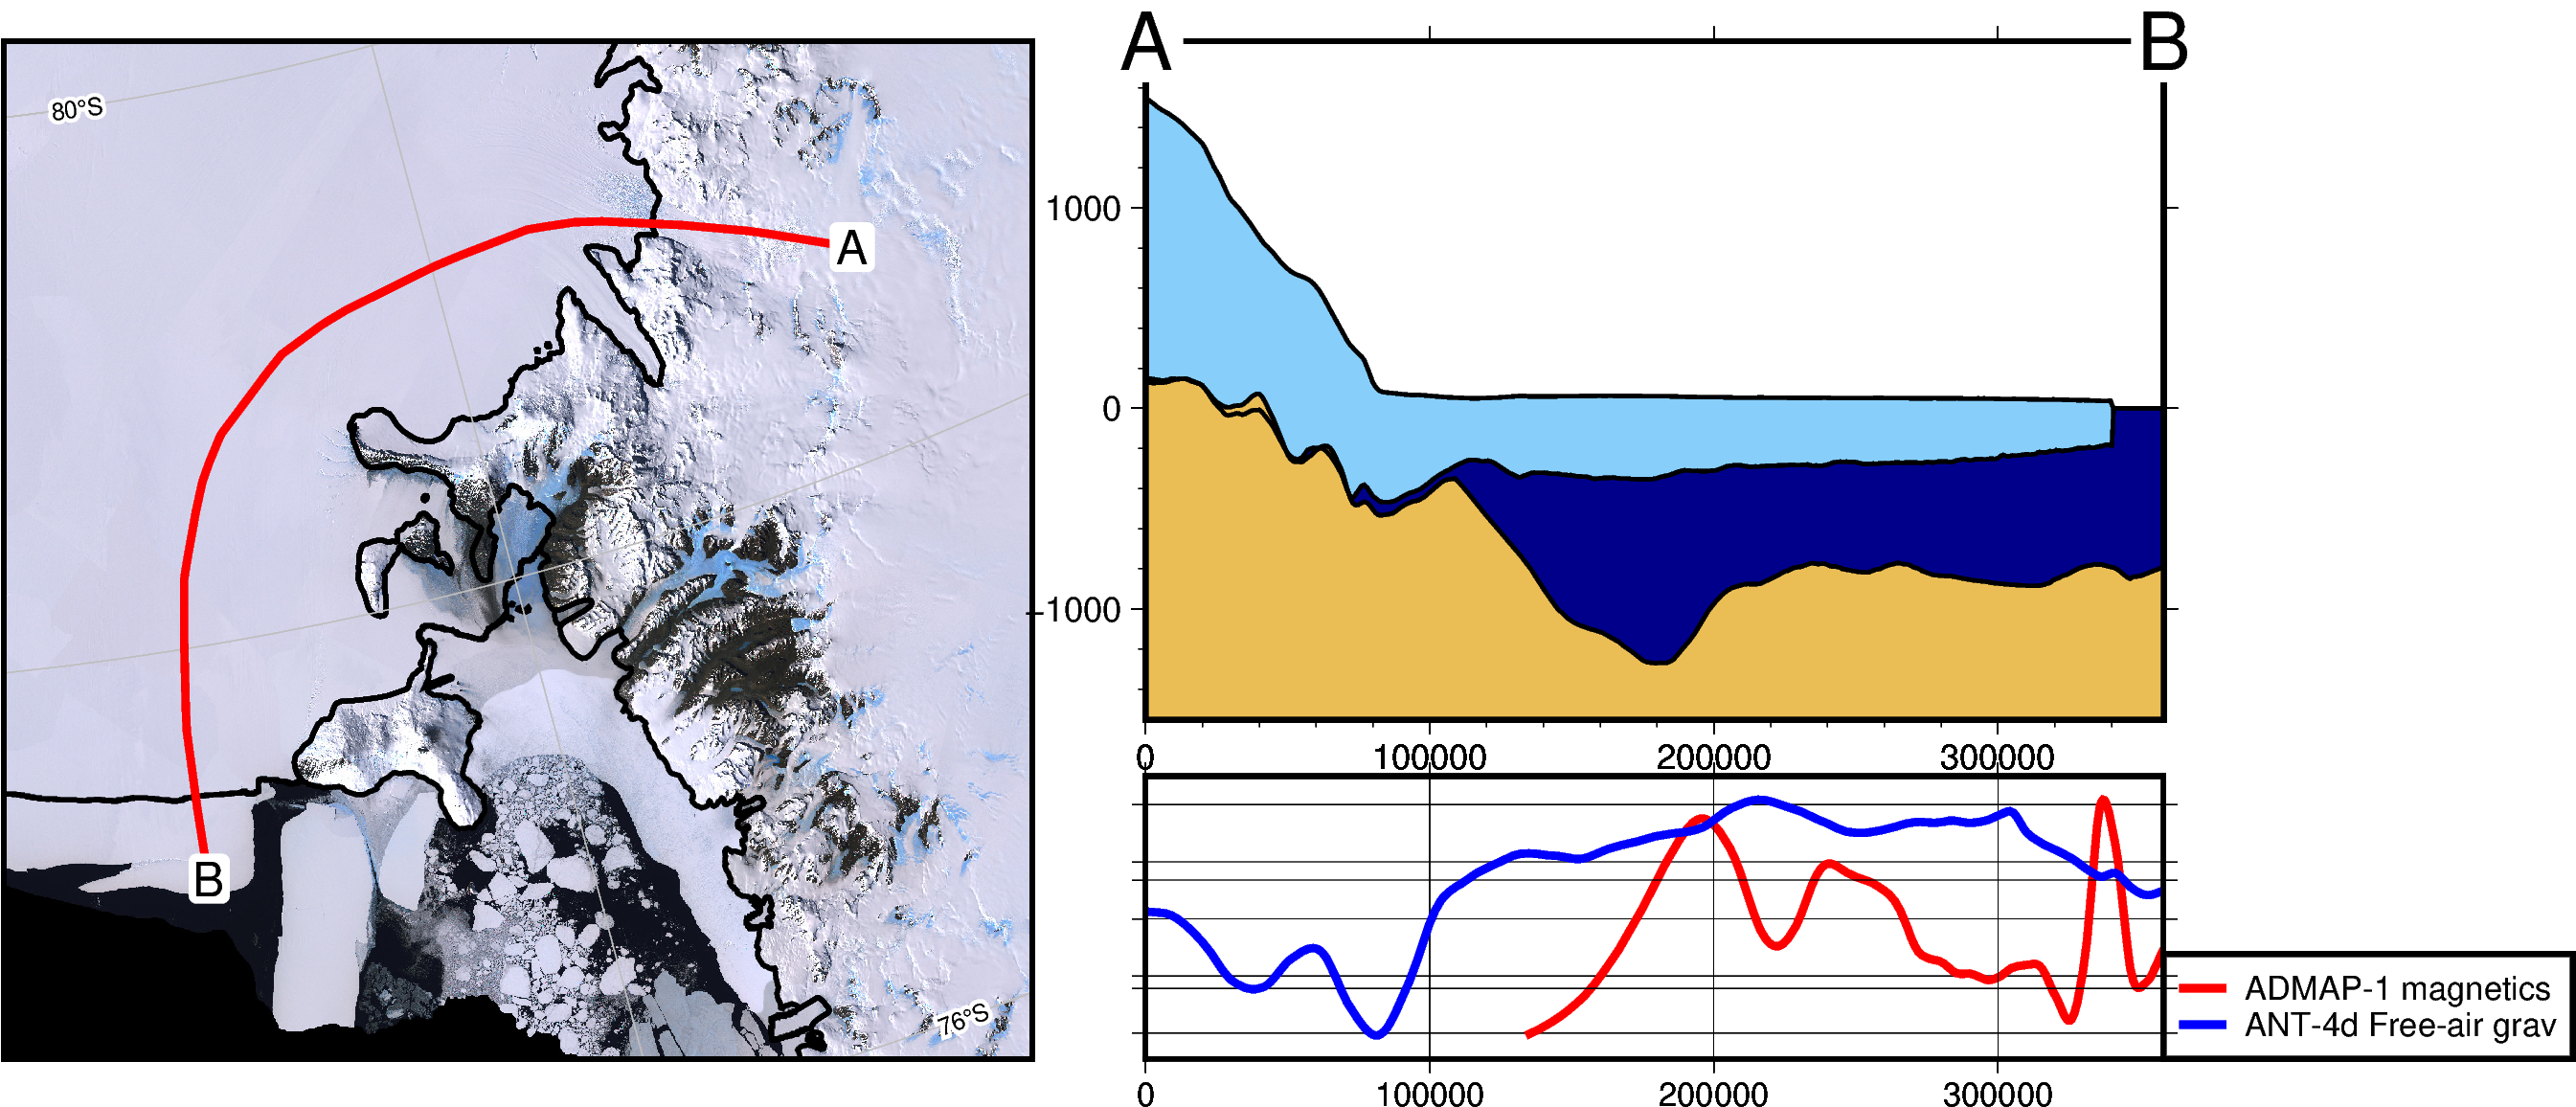
This python package provides some basic tools for creating maps and plots specific to Antarctica. It includes code to download common continent-wide datasets (i.e. Bedmap2, AntGG, ADMAP), and visualize them in a variety of ways, including cross sections and maps.
Follow along with the Walkthrough that runs through some of the main functions and usages of this package.
Feel free to use, share, modify, and contribute to this project. I’ve mostly made this for private usage so for now the documentation is sparse.