Antarctic-plots
Contents
Antarctic-plots#
Functions to automate Antarctic data visualization
![]()


![]()


Disclaimer#
🚨 **This package is in early stages of design and implementation.** 🚨
I welcome any feedback, ideas, or contributions! Please submit an issue on Github for problems or feature ideas.
About#
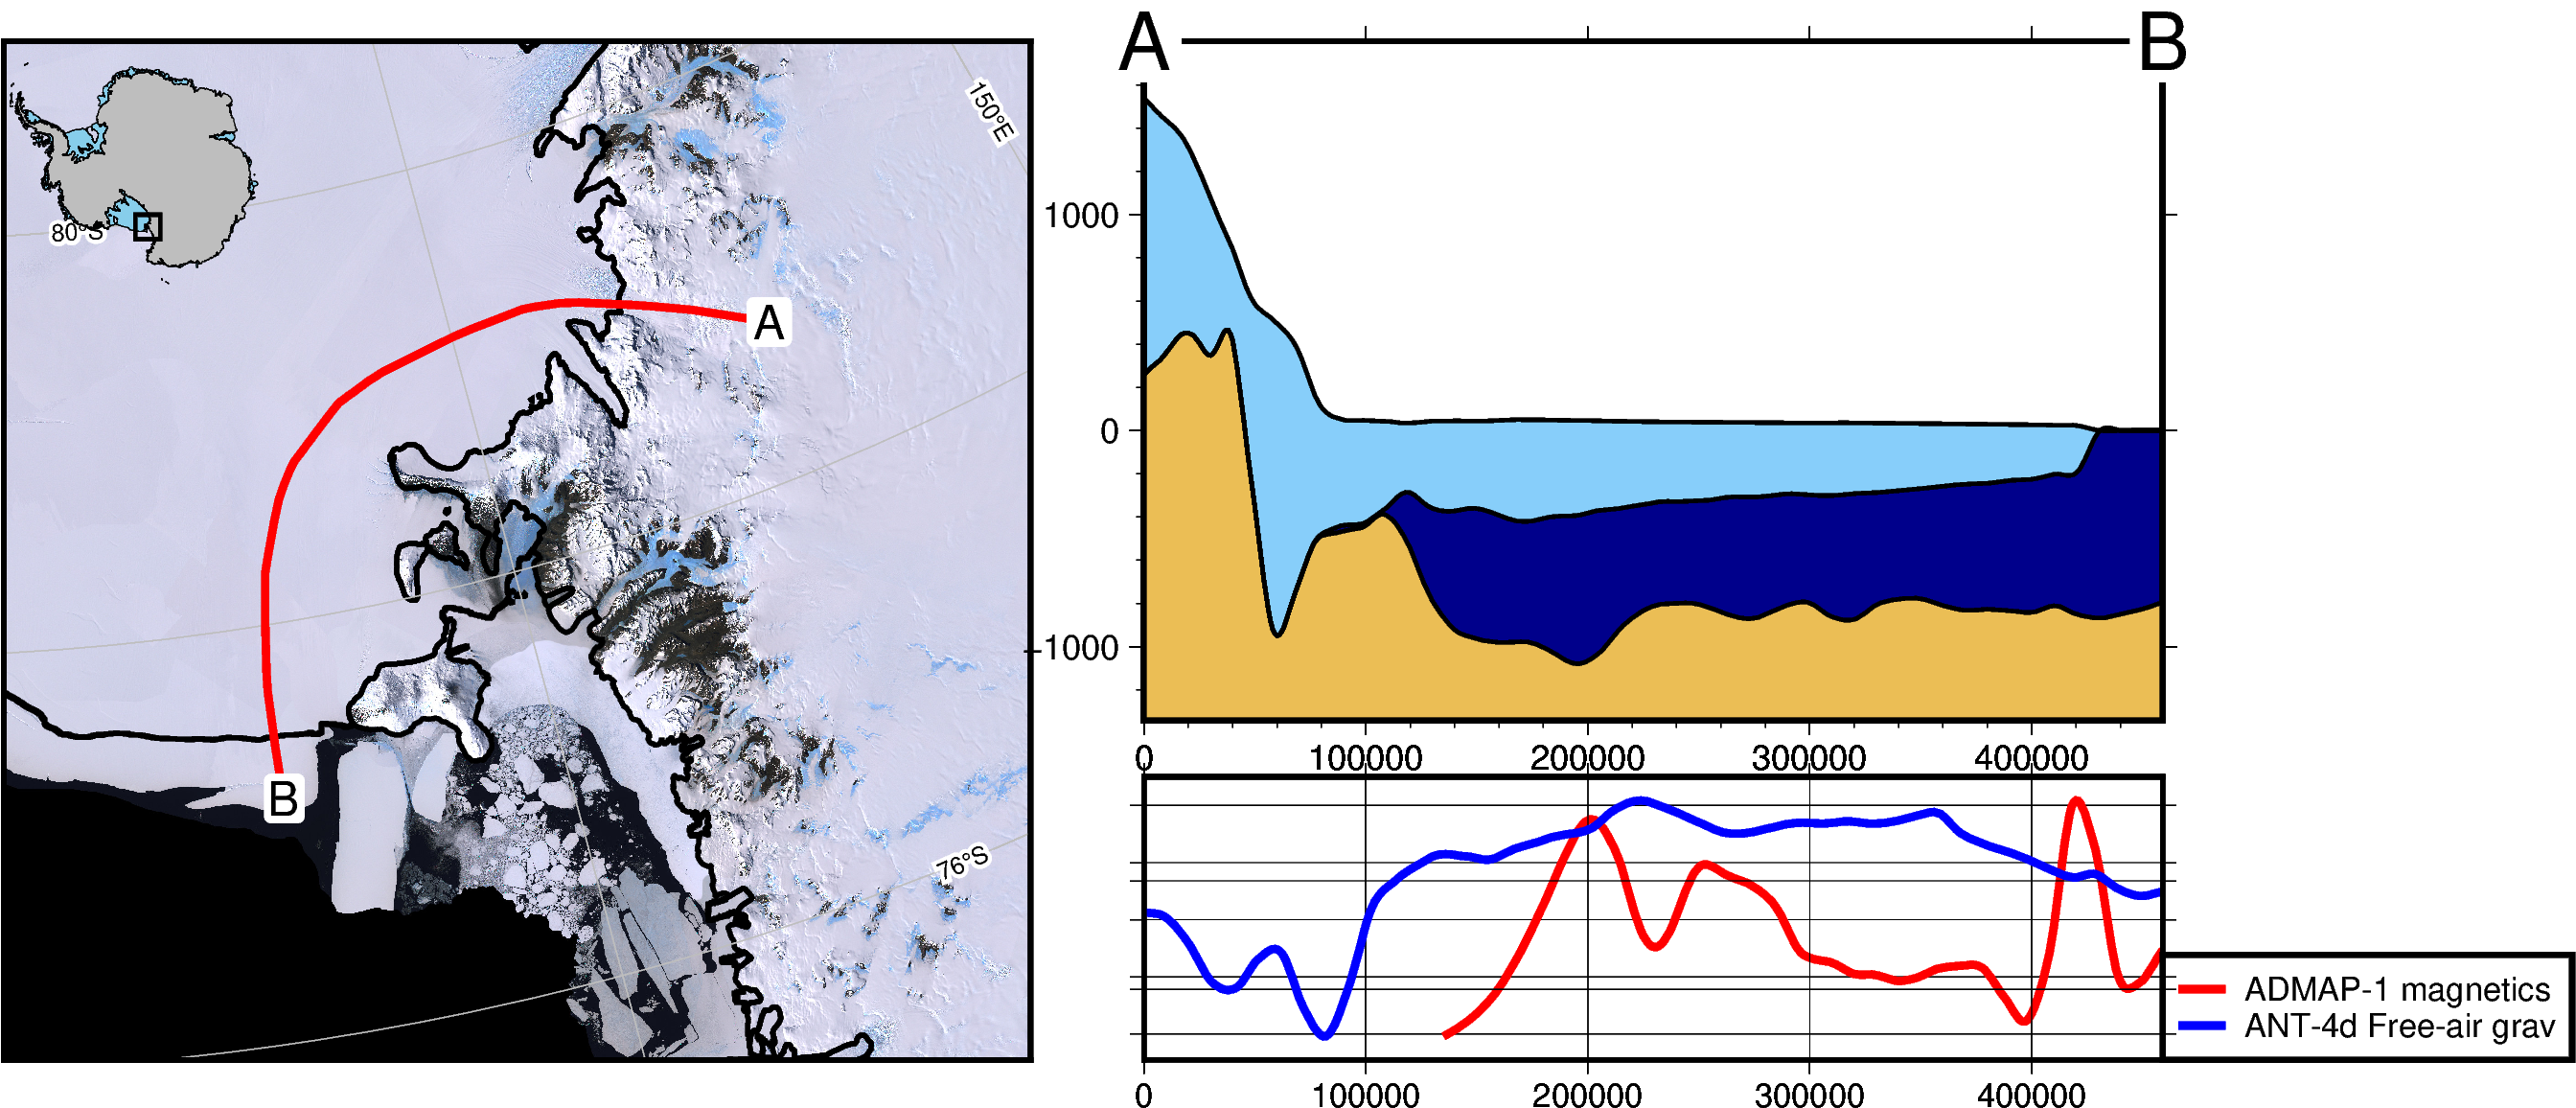
This python package provides some basic tools for creating maps and plots specific to Antarctica. It includes code to download common continent-wide datasets (i.e. Bedmap2, AntGG, ADMAP), and visualize them in a variety of ways, including cross sections and maps.
Look through the Gallery examples and the Tutorials to see some of the main functions and usages of this package.
Feel free to use, share, modify, and contribute to this project. I’ve mostly made this for personal usage so expect signficant changes and hopefully I’ll implement some tests and more Gallery examples soon.
Project goals#
Below is a list of some feature I hope to eventually include. Feel free to make a feature request through Github Issues.
Create 3D interactive models to help visualize data.
Plot data in 3D.
Plot grids and data in interactive windows using
ipyleaflet.Include more Antarctic datasets to aid in download and storage.
If there’s interest, extend to the Arctic or possibly anywhere.